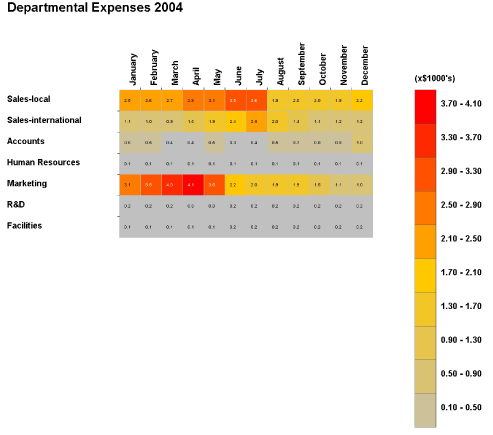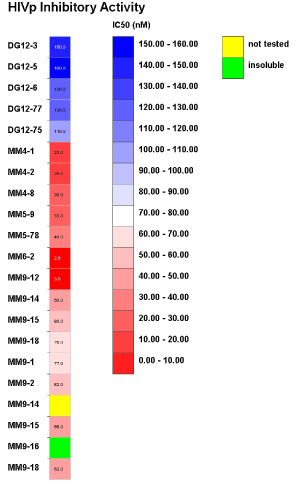
Color-grids are an efficient means of representing data in a high density, easily interpretable form. For this reason, JColorGrid has been written to be generally useful, independent of the source or type of data. Listed are some worked applications of JColorGrid in the Biological Sciences, and Business and Finance.
Structure-Activity
Relationship Tables:
In this example, compounds and their associated biological acitivity (IC50)
have been grouped according to chemical similarity in the input .xls file. A
color-grid of this data reveals structure-activity information. Compounds that
were not assayed ('not tested' and 'insoluble') are highlighted as exceptions
in the exceptions key.

JColorGrid can output to an .EPS format making post processing of the graphics file possible. In the following example the .EPS file has been dropped into a graphics editor and reformatted for publication. Elements of the .EPS file can be 'Ungrouped' in a graphics editor and resized, rotated independently.
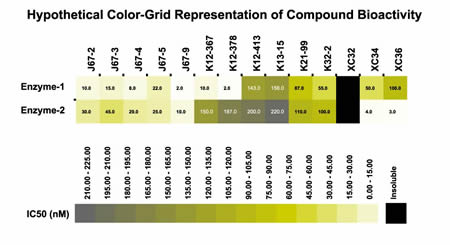
Plate-Reader
Data:
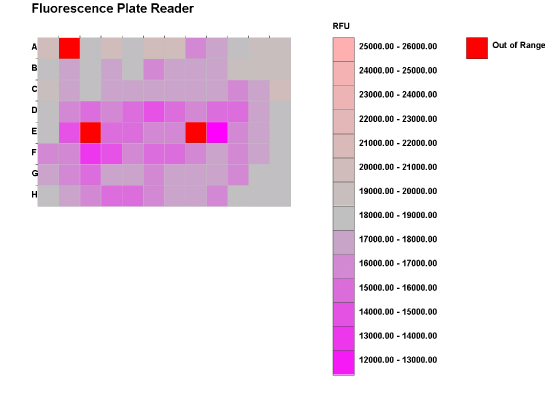
Color-grids are an excellent means of visualizing raw data from absorbance and
fluorescence plate readers. In this example, a minimum RFU (relative fluorescence
units) has been set to 12,000. Wells of the microplate with less than 12,000
RFU are colored red, as being out of the user specified range. 'Display Values'
has been set to 'false' such that data is not displayed in the cells of the
colorgrid.
Correlation
Matrices:
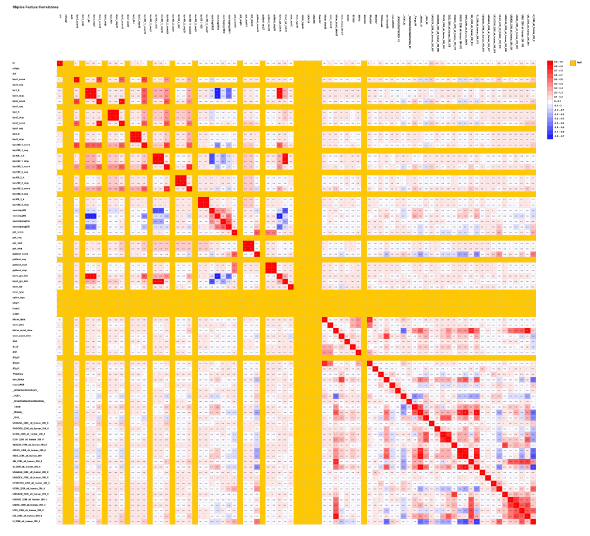
Large correlation matrices can contain an enormous number of data points. Individual
cells, or areas of the color-grid can be viewed in detail by zooming on the
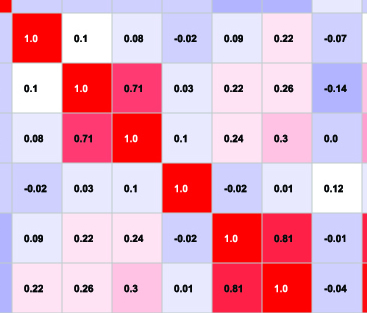
image in a suitable graphics editor. The lower zoomed image of the correlation
matrix illustrates individual numerical data associated with the cell has been
retained in the color-grid to allow closer analysis. With an EPS output, large
graphics files, like this one, can be cropped to present data from a specific
correlate, while retaining high resolution.
Financial
Reporting:
Color-Grids reduce
the complexity sometimes associated with traditional data graphs. This makes
them ideal for financial reporting where trends must often be presented to non-experts.
Color-grids are excellent for seminars and publications.
